Study Tracker
Trackly was built to tackle the challenge of staying consistent with studying. Instead of manually logging sessions, the app features a timer system where users choose a study length and then start, pause, resume, or stop the timer. This makes tracking effortless and closer to how study time actually happens.
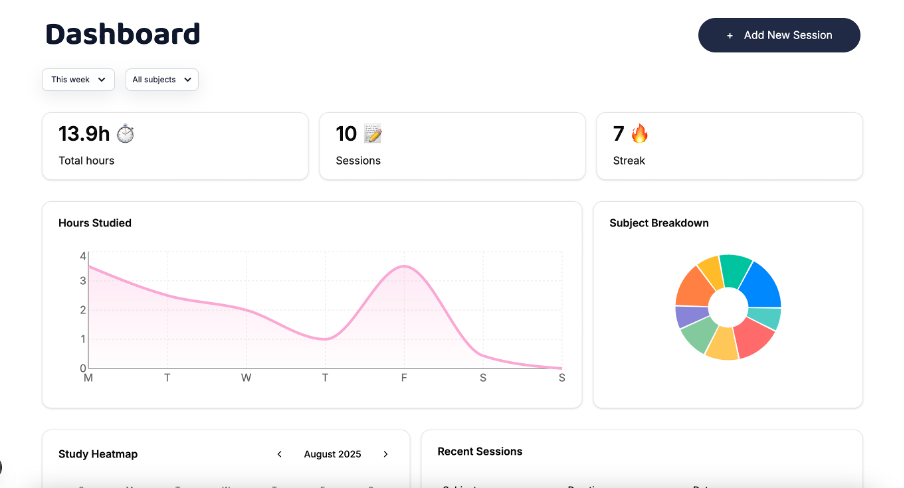
The dashboard provides an at-a-glance summary: total study hours, streaks, and how time is split across subjects. Data is presented visually with a GitHub-style heatmap calendar, a line chart of daily hours, and a donut chart for subject distribution. The goal was to keep the design clean and motivating, avoiding clutter while still providing insights into habits.
Built with Next.js, Tailwind, and Recharts, Trackly focused on responsive layouts, smooth interactions, and modular component architecture. The project highlighted skills in both front-end design and data visualization, resulting in a tool that supports productivity through clear, simple tracking.
Tools & Technologies
Project Overview
Key Takeaways
- •Architected a full-stack web application with Next.js 15 and PostgreSQL, integrating App Router with custom API routes to handle session data securely and efficiently
- •Leveraged the Recharts library to implement diverse data visualizations, including time-series line charts, contribution-style heatmaps, and donut charts, ensuring interactive and performant rendering.
- •Applied React state management and custom hooks to enable dynamic filtering, real-time updates, and seamless synchronization between the client UI and backend APIs.
- •Designed and normalized a PostgreSQL schema with relational integrity and constraints, optimizing queries for scalability and accurate session tracking.
- •Built responsive, accessible UI components using Tailwind CSS and shadcn/ui, balancing modern styling with consistent cross-device usability.
Challenges Overcome
- •Debugged chart re-render issues in Recharts and optimized performance for frequent state updates.
- •Balanced clean UI design with responsive layouts for data-heavy components like heatmaps and charts.
- •Implemented dynamic filtering logic that updated charts instantly without triggering full reloads.
- •Tuned SQL queries to balance accuracy of streaks and summaries with database performance.